Análisis de Inspecciones de Consumo en Madrid durante el primer Semestre de 2017
Vamos a analizar el fichero de Inspecciones de Consumo realizadas por el Ayuntamiento de Madrid durante el primer semestre de 2017, con información sacada del portal de OpenData : http://datos.madrid.es
Como siempre importamos las librerias necesarias : pandas, numpy y matplotlib:
import pandas as pd
import numpy as np
import matplotlib
import matplotlib.pyplot as plt
import datetime
import matplotlib.dates as mdates
%matplotlib inline
import matplotlib.ticker as mtick
from matplotlib.ticker import FuncFormatter
pd.options.display.float_format = '{:,.1f}'.format
Preparamos una texto para incluirlo en cada gráfico como fuente…
fuente='Fuente : Ayuntamiento de Madrid, http://datos.madrid.es'
Preparando la URL de la fuente de datos
path_web='http://datos.madrid.es/egob/catalogo/300079-2-inspecciones-consumo.csv'
inspecciones=pd.read_csv(path_web,sep=";",encoding='windows-1250',index_col=False)
confirmamos que ha bajado correctamente, viendo el nº de registros (nº de inspecciones)
len(inspecciones)
5845
inspecciones.columns
Index([‘FECHA_DE_INSPECCION’, ‘DISTRITO’, ‘TIPO_VIAL_ACCESO_PRINCIPAL’,
‘NOMBRE_VIA_ACCESO_PRINCIPAL’, ‘NUMERO_VIA_ACCESO_PRINCIPAL’,
‘ACTIVIDAD_INSPECTORA’, ‘AMBITO’, ‘EPIGRAFE’, ‘Unnamed: 8′],
dtype=’object’)
Qué es esa columna llamada ‘Unnamed: 8’?. Tiene toda la pinta de ser un error de carga del fichero. Comprobémoslo, y borrémosla si así es :
inspecciones['Unnamed: 8'].head(10)
0 nan
1 nan
2 nan
3 nan
4 nan
5 nan
6 nan
7 nan
8 nan
9 nan
Name: Unnamed: 8, dtype: float64
inspecciones.drop('Unnamed: 8',axis=1,inplace=True)
inspecciones.columns
Index([‘FECHA_DE_INSPECCION’, ‘DISTRITO’, ‘TIPO_VIAL_ACCESO_PRINCIPAL’,
‘NOMBRE_VIA_ACCESO_PRINCIPAL’, ‘NUMERO_VIA_ACCESO_PRINCIPAL’,
‘ACTIVIDAD_INSPECTORA’, ‘AMBITO’, ‘EPIGRAFE’],
dtype=’object’)
Veamos una muestra (las cinco primeras filas) del tipo de datos que nos encontramos :
inspecciones.head(5)
| FECHA_DE_INSPECCION | DISTRITO | TIPO_VIAL_ACCESO_PRINCIPAL | NOMBRE_VIA_ACCESO_PRINCIPAL | NUMERO_VIA_ACCESO_PRINCIPAL | ACTIVIDAD_INSPECTORA | AMBITO | EPIGRAFE | |
|---|---|---|---|---|---|---|---|---|
| 0 | 02/01/2017 | 06 – TETUAN | CL | ORENSE | 69 | 10 – Inspección | 10 – Consumo | 951001 – REPARACION DE ORDENADORES Y EQUIPOS D… |
| 1 | 02/01/2017 | 20 – SAN BLAS – CANILLEJAS | CL | RUMANIA | 18 | 10 – Inspección | 10 – Consumo | 475206 – COMERCIO AL POR MENOR DE MATERIAL ELE… |
| 2 | 02/01/2017 | 20 – SAN BLAS – CANILLEJAS | CL | RUMANIA | 16 | 10 – Inspección | 10 – Consumo | 475906 – COMERCIO AL POR MENOR DE APARATOS DE … |
| 3 | 02/01/2017 | 13 – PUENTE VALLECAS | AV | ALBUFERA | 0 | 10 – Inspección | 10 – Consumo | 47800106 – SITUADOS: ARTICULOS NAVIDEŃOS NO AL… |
| 4 | 02/01/2017 | 13 – PUENTE VALLECAS | AV | ALBUFERA | 0 | 10 – Inspección | 10 – Consumo | 47800108 – SITUADOS: COMPLEMENTOS, BISUTERIA Y… |
Reformateamos la columna de FECHA_DE_INSPECCION para convertirlo en datetime
inspecciones['FECHA_DE_INSPECCION']=pd.to_datetime(inspecciones['FECHA_DE_INSPECCION'],format='%d/%m/%Y')
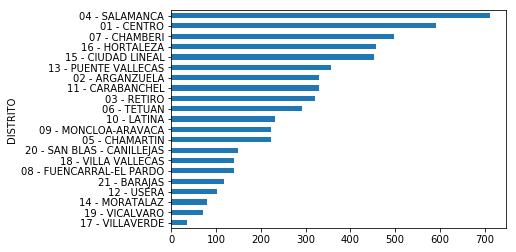
Empecemos con unos gráficos: nº de inspecciones por distritos :
inspecciones.groupby('DISTRITO').size().sort_values().plot.barh()
Contruyamos ahora unas tablas, la primera con el top 20 de direcciones con más inspecciones, y la segunda con el top de inspecciones en el distrito con más inspecciones : Barrio Salamanca
inspecciones.groupby(['NOMBRE_VIA_ACCESO_PRINCIPAL','NUMERO_VIA_ACCESO_PRINCIPAL']).size().sort_values(ascending=False).head(20)
NOMBRE_VIA_ACCESO_PRINCIPAL NUMERO_VIA_ACCESO_PRINCIPAL
ESTACION DE HORTALEZA 0 142
AREQUIPA 1 127
LAS AGUILAS 0 99
CAMPILLO DEL MUNDO NUEVO 0 97
CALDERILLA 1 93
MONFORTE DE LEMOS 30 73
ARACNE 3 69
ALCALA 412 56
FLORIDA 2 48
ADOLFO BIOY CASARES 2 42
CASTELLANA 204 39
ARTURO SORIA 126 36
AYERBE 0 30
CLAUDIO MOYANO 0 26
GENERAL PERON 40 26
PUERTO DEL BRUCH 4 25
SILVANO 77 25
RAMON PEREZ DE AYALA 0 22
ALCALA 237 19
GUATAVITA 1 18
dtype: int64
inspecciones[inspecciones['DISTRITO']=='04 - SALAMANCA'].groupby(['NOMBRE_VIA_ACCESO_PRINCIPAL','NUMERO_VIA_ACCESO_PRINCIPAL']).size().sort_values(ascending=False).head(20)
NOMBRE_VIA_ACCESO_PRINCIPAL NUMERO_VIA_ACCESO_PRINCIPAL
ALCALA 237 19
CLAUDIO COELLO 88 10
AMERICA 4 9
HERMOSILLA 26 8
BOCANGEL 1 8
CLAUDIO COELLO 38 7
BRUSELAS 60 7
TOREROS 24 6
BRUSELAS 63 6
MARQUES DE ZAFRA 9 6
BRUSELAS 41 6
GOYA 17 6
LAGASCA 88 6
DON RAMON DE LA CRUZ 17 6
SERRANO 61 6
MARTINEZ IZQUIERDO 14 5
BRUSELAS 38 5
ALCALA 231 5
CARTAGENA 24 5
AMERICA 28 5
dtype: int64
Os preguntáis qué hay en Alcalá, 237 ??. Y en Estación de Hortaleza, 0 ??..en este caso no es inmediato, pero podremos comprobar que se refiere al Mercado Dominical de Hortaleza
Veamos en qué días se realizan esas inspecciones :
inspecciones[inspecciones['NOMBRE_VIA_ACCESO_PRINCIPAL']=='ESTACION DE HORTALEZA'].groupby(['FECHA_DE_INSPECCION']).size().plot.bar()
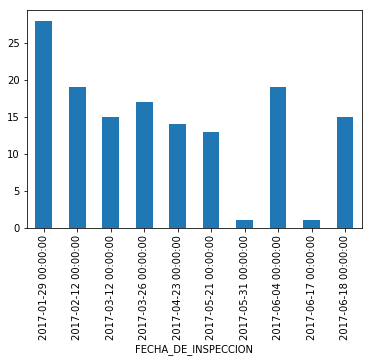
Vemos que esos días se corresponden con Domingo
A continuación veamos la diestribución por meses…(1-> Enero, 2->Febrero, ……)
inspecciones.groupby([inspecciones["FECHA_DE_INSPECCION"].dt.month]).size().plot(kind="bar")

Por semanas :
inspecciones.groupby([inspecciones["FECHA_DE_INSPECCION"].dt.week]).size().plot(kind="bar")

La semana 15 coincidió con la Semana Santa
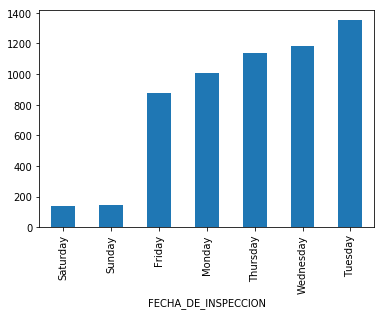
...y finalmente la distribución por días :
inspecciones.groupby([inspecciones["FECHA_DE_INSPECCION"].dt.weekday_name]).size().sort_values().plot(kind="bar")
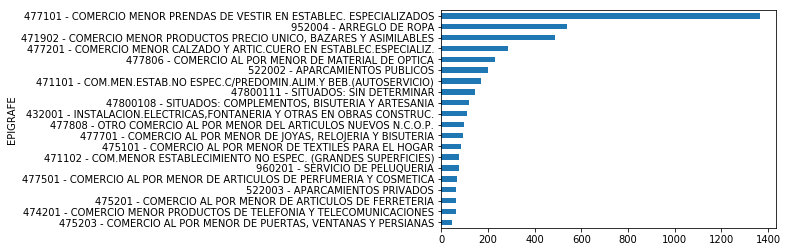
Veamos ahora la distribución de las inspecciones según el EPIGRAFE del comercio/local afectado :
inspecciones.groupby(['EPIGRAFE']).size().sort_values(ascending=True).tail(20).plot.barh()
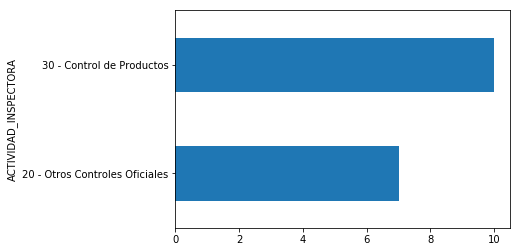
Y por último echemos un vistazo a los tipos de ACTIVIDAD_INSPECTORA, viendo la lista de inspecciones de una de ellas…
inspecciones['ACTIVIDAD_INSPECTORA'].unique()
array([’10 – Inspección’, ’30 – Control de Productos’,
’20 – Otros Controles Oficiales’], dtype=object)
inspecciones.groupby(['ACTIVIDAD_INSPECTORA']).size().sort_values(ascending=True).head(2).plot.barh()
inspecciones[inspecciones['ACTIVIDAD_INSPECTORA']=='30 - Control de Productos']
| FECHA_DE_INSPECCION | DISTRITO | TIPO_VIAL_ACCESO_PRINCIPAL | NOMBRE_VIA_ACCESO_PRINCIPAL | NUMERO_VIA_ACCESO_PRINCIPAL | ACTIVIDAD_INSPECTORA | AMBITO | EPIGRAFE | Unnamed: 8 | |
|---|---|---|---|---|---|---|---|---|---|
| 159 | 19/01/2017 | 12 – USERA | CL | MARIBLANCA | 11 | 30 – Control de Productos | 10 – Consumo | 471104 – COM.MENOR PRODUCTOS ALIMENTICIOS NO P… | nan |
| 313 | 23/01/2017 | 01 – CENTRO | CL | GRAN VIA | 29 | 30 – Control de Productos | 10 – Consumo | 476101 – COMERCIO AL POR MENOR DE LIBROS | nan |
| 613 | 02/02/2017 | 21 – BARAJAS | CL | AGUETOL | 8 | 30 – Control de Productos | 10 – Consumo | 471901 – COM.MENOR ESTABL.NO ESPEC.S/PREDOMINI… | nan |
| 1199 | 09/01/2017 | 07 – CHAMBERI | CL | RIOS ROSAS | 2 | 30 – Control de Productos | 10 – Consumo | 475901 – COMERCIO AL POR MENOR DE MUEBLES | nan |
| 1489 | 24/02/2017 | 01 – CENTRO | CL | FUENCARRAL | 94 | 30 – Control de Productos | 10 – Consumo | 477808 – OTRO COMERCIO AL POR MENOR DEL ARTICU… | nan |
| 1495 | 24/02/2017 | 01 – CENTRO | CL | FUENCARRAL | 94 | 30 – Control de Productos | 10 – Consumo | 477808 – OTRO COMERCIO AL POR MENOR DEL ARTICU… | nan |
| 1498 | 24/02/2017 | 01 – CENTRO | CL | FUENCARRAL | 94 | 30 – Control de Productos | 10 – Consumo | 477808 – OTRO COMERCIO AL POR MENOR DEL ARTICU… | nan |
| 1503 | 24/02/2017 | 01 – CENTRO | CL | FUENCARRAL | 94 | 30 – Control de Productos | 10 – Consumo | 477808 – OTRO COMERCIO AL POR MENOR DEL ARTICU… | nan |
| 2595 | 21/01/2017 | 10 – LATINA | AV | LAS AGUILAS | 0 | 30 – Control de Productos | 10 – Consumo | 477101 – COMERCIO MENOR PRENDAS DE VESTIR EN E… | nan |
| 5018 | 31/05/2017 | 08 – FUENCARRAL-EL PARDO | AV | MONFORTE DE LEMOS | 30 | 30 – Control de Productos | 10 – Consumo | 476501 – COMERCIO AL POR MENOR DE JUEGOS Y JUG… | nan |
Eso es todo, tengo pendiente el aprender a presentar estos datos en mapas, con diagramas de calor etc…Tarea pendiente..
